Remote Sensing Agricultural Methane Using Satellite Products
- john06025
- Apr 1
- 8 min read
Methane emissions from agricultural activities, particularly livestock operations such as feedlots, represent a significant contributor to Australia’s GHG footprint. In this post, we will consider the scale of Australia’s agricultural methane challenge, along with current and emerging methane remote sensing options available.
1. Australian Agricultural Methane
Australia’s agricultural methane sector is dominated by livestock production, with 4,200 commercial dairy farms and 450 accredited cattle feedlots operating as of 2023 [1,2]. According to the Australian Department of Climate Change, Energy, the Environment and Water (DCCEEW), livestock methane emissions constitute approximately 70% of greenhouse gas emissions from the agriculture sector and about 13% of Australia's total emissions [3,4].
Enteric fermentation accounts for the majority of agricultural methane, with ruminants contributing ~70% of total livestock emissions due to microbial fermentation in their digestive systems [5]. Research from UNSW indicates that Australia's cattle population of approximately 30 million produced an estimated 1.4 million tonnes of methane emissions from enteric fermentation in 2022 [6].
On a facility level, there is considerable uncertainty as to methane emissions from feedlots and dairies. Based on US surveys, including AVIRIS-NG campaigns and satellite products, large facilities emit approximately 100–300 kg CH₄/hour under normal operations, with peak manure stockpiling or anaerobic lagoons generating up to 800–1,200 kg CH₄/hour [7, 8].
In addition to these primary agricultural sources, some lesser sources include rice paddies, burning crop stubble, composting and crop residue decomposition, poultry manure management, biogas digester leaks, and manure applied to fields. Some agricultural waste is also deposited into landfills, which are highly characterized methane sources. In Australia, agricultural waste constitutes ~10–15% of landfill inputs, although methane yields depend on waste composition and management practice [9].
2. Remote Sensing Solutions
Agricultural methane emissions pose unique detection challenges due to their distributed and low-flux. Most farms emit <500 kg CH₄/hour, below the detection thresholds of traditional satellites like Sentinel-5P. Transient emission peaks - such as those during milking or manure handling - require frequent revisits to capture accurately, a capability lacking in most satellite systems. Agricultural emissions are also more likely to be diffuse, making them more challenging to detect versus concentrated point sources.
2.1 Airborne Products
We briefly consider airborne modalities which, in terms of detection thresholds, can be considered a benchmark. AVIRIS-NG, a NASA-developed hyperspectral sensor, is the gold standard for pinpointing agricultural methane sources. With a detection threshold of 5–20 kg CH₄/hour and spatial resolution of 3–5 m, it can isolate emissions from individual barns or manure ponds [10]. For example, a 2016 campaign in California identified methane plumes as small as 10 kg/hour from dairy farms, linking emissions to specific infrastructure like broken digesters [11].
However, the utility of AVIRIS-NG is constrained by cost (campaigns cost $100k+ per day), and limited coverage, restricting its use to research or regulatory investigations [12]. ASU GAO offers similar capabilities, detecting emissions as low as 10–30 kg CH₄/hour at 1–5 m resolution [13]. Examples of these products are shown in Fig1/2.
![Fig.1 piggery in North Carolina, USA, Sept 2022. AVIRIS-NG, 534 +/- 234 kg CH4/hr. [8].](https://static.wixstatic.com/media/86b4fe_f81d9ada68484e10a34515b8eea5451a~mv2.png/v1/fill/w_980,h_928,al_c,q_90,usm_0.66_1.00_0.01,enc_avif,quality_auto/86b4fe_f81d9ada68484e10a34515b8eea5451a~mv2.png)
![Fig.2. biogas leak, in Wyoming, USA, Oct 2022. ASU GAO, not quantified [8].](https://static.wixstatic.com/media/86b4fe_880dc0922de54af292562a8f31a07559~mv2.png/v1/fill/w_980,h_693,al_c,q_90,usm_0.66_1.00_0.01,enc_avif,quality_auto/86b4fe_880dc0922de54af292562a8f31a07559~mv2.png)
2.2 TROPOMI (Sentinel-5P)
TROPOMI provides daily global coverage, but with a coarse resolution and relatively high detection threshold. At launch it had a spatial resolution of 7 × 3.5 km² at nadir. In August 2019, this was enhanced to 5.5 × 3.5 km², with a detection threshold of ~1,000 kg CH₄/hour. A 2022 study aggregated TROPOMI data over time to detect large dairy farms in California, although this approach relies on having densely clustered emitters [14]. Nonetheless, this study shows the utility and potential of regional approaches using TROPOMI products. A regional analysis from this study is shown in Fig.3. Larger emissions might also be detectable using aggregation.
![Fig.3 Methane concentrations overlaid with dairy operations in Canada [14]. Measured using Sentinel-5P satellite data averaged from 2018 to 2023.](https://static.wixstatic.com/media/86b4fe_0a727bf5b023412b84a6446bc54c5b03~mv2.png/v1/fill/w_980,h_757,al_c,q_90,usm_0.66_1.00_0.01,enc_avif,quality_auto/86b4fe_0a727bf5b023412b84a6446bc54c5b03~mv2.png)
2.3 Sentinel-2
Sentinel-2 has detected large plumes from fossil fuel infrastructure, with a detection threshold of slightly under 1,000 kg/h [15]. However, Agricultural methane plumes are small, diffuse, and transient, making it challenging for this modality. Peak emissions discussed above are approaching detection limits, but based on our literature search, Sentinel-2 detections of agricultural emissions have not yet been confirmed.
2.4 WorldView-3
WorldView-3 products provide unprecedented spatial resolution (3.7m in multispectral mode) for methane plume detection. Sánchez-García et al. demonstrated WorldView-3’s ability to map methane plumes at very high spatial resolutions, identifying emissions from oil and gas infrastructure with thresholds as low as 50–100 kg CH₄/hour [16]. This capability stems from its narrow spectral bands (10–30 nm), which enhance methane signal isolation compared to broadband sensors like Sentinel-2 (Fig.4). For agricultural applications, such resolution could theoretically resolve emissions from individual farm components, such as manure ponds or barns, particularly in clustered facilities like cattle feedlots.
However, tasking costs and infrequent revisits (~4–5 days under optimal conditions) hinder systematic monitoring of transient peaks, such as emissions during manure handling. Nonetheless, WorldView-3 could serve as a complementary tool for validating airborne surveys or investigating high-priority facilities where spatial precision is critical. In the absense of published agriculatural methane examples, an O&G excample is shown in Fig.4.
![Fig.4 methane leaks from Turkmenistan North O&G field on 29 March 2021 [16]. The rightmost emission has a flux rate of ~30 kg h−1 CH4. Left: WorldView-3 visual spectra. Middle: methane enhancement using WorldView-3. Right: methane enhancement using Sentinel-2 approximation.](https://static.wixstatic.com/media/86b4fe_fdaa906873a0451382cced8830eebccc~mv2.png/v1/fill/w_980,h_324,al_c,q_85,usm_0.66_1.00_0.01,enc_avif,quality_auto/86b4fe_fdaa906873a0451382cced8830eebccc~mv2.png)
2.5 ISS EMIT
Mounted on the International Space Station, EMIT's hyperspectral sensor detects emissions as low as 50–100 kg CH₄/hour at 60 m resolution [17]. While its spectral precision improves methane isolation, its dust-focused mission design and irregular revisit times (3–16 days) limit systematic agricultural monitoring [17]. An example is shown in Fig.5.
![Fig.5 dairy in Colorado, USA, Oct 2024. ISS EMIT, 395 +/- 131 kg CH4/hr [8].](https://static.wixstatic.com/media/86b4fe_9afb8c4f1cf04dee8599c28425f66b54~mv2.png/v1/fill/w_980,h_693,al_c,q_90,usm_0.66_1.00_0.01,enc_avif,quality_auto/86b4fe_9afb8c4f1cf04dee8599c28425f66b54~mv2.png)
2.6. GHGSat
GHGSat is a commercial, tasked satellite with 25m resolution, which can detect emissions as low as 100 kg CH₄/hour. It has successfully identified feedlot emissions in North America [18]. However, its reliance on tasking make it expensive, and infrequent revisits (days to weeks) limit scalability [18]. An example GHGSat product is show in Fig.6.
![Fig.6 feedlot in California, USA, Oct 2024. GHGSat, ppb as shown [18, 19].](https://static.wixstatic.com/media/86b4fe_0dc39de0f7ed4725929c5a4c22def36e~mv2.jpg/v1/fill/w_980,h_705,al_c,q_85,usm_0.66_1.00_0.01,enc_avif,quality_auto/86b4fe_0dc39de0f7ed4725929c5a4c22def36e~mv2.jpg)
2.7. Tanager-1 (Carbon Mapper)
Tanager-1 is one of the emerging satellite products, which has been developed specifically for methane monitoring. It combines 30m resolution with a detection threshold of ~50 kg CH₄/hour [20]. Its open-access data and focus on point sources make it promising for agricultural monitoring, though coverage will initially primarily target high-priority regions in the oil and gas space [20]. Early results in the agricultural space have been extremely positive and we shows several examples below (Fig.7/8).
![Fig.7 dairy in California, USA, Oct 2024. Tanager-1, 400 +/- 177 kg CH4/hr. Quantification is preliminary [8].](https://static.wixstatic.com/media/86b4fe_79df385bc6aa48fa8200c441da7c2db3~mv2.png/v1/fill/w_980,h_712,al_c,q_90,usm_0.66_1.00_0.01,enc_avif,quality_auto/86b4fe_79df385bc6aa48fa8200c441da7c2db3~mv2.png)
![Fig.8 dairy in California, USA, Feb 2025. Tanager-1, 724 +/- 71 kg CH4/hr. Quantification is preliminary [8].](https://static.wixstatic.com/media/86b4fe_88c5d23a24834d2193d55a42a85a7a40~mv2.png/v1/fill/w_980,h_811,al_c,q_90,usm_0.66_1.00_0.01,enc_avif,quality_auto/86b4fe_88c5d23a24834d2193d55a42a85a7a40~mv2.png)
2.8 MethaneSAT
MethaneSAT is the second major emerging product for methane monitoring. It offers unparalleled sensitivity (~20 kg CH₄/hour), and near-daily global coverage [21]. While initially prioritizing oil and gas, its 1*1 km resolution and wide swath (200 km) could significantly enhance agricultural monitoring by capturing cumulative emissions from clustered farms when it becomes fully operational and encompasses more agricultural targets [21]. At this time of writing, agricultural examples are not available, although Bryce Kelly et al. of UNSW have been commissioned to evaluate its efficacy in this space [6]. We show an example from the oil and gas space below (Fig.9).
![Fig.9 MethaneSat product showing concentrations over a large region of Turkmenistan, demonstrating the product's utility for detecting O&G point sources [21, 22].](https://static.wixstatic.com/media/86b4fe_de5e6b879a5c41e6b2212b6b39e1ddc4~mv2.png/v1/fill/w_980,h_709,al_c,q_90,usm_0.66_1.00_0.01,enc_avif,quality_auto/86b4fe_de5e6b879a5c41e6b2212b6b39e1ddc4~mv2.png)
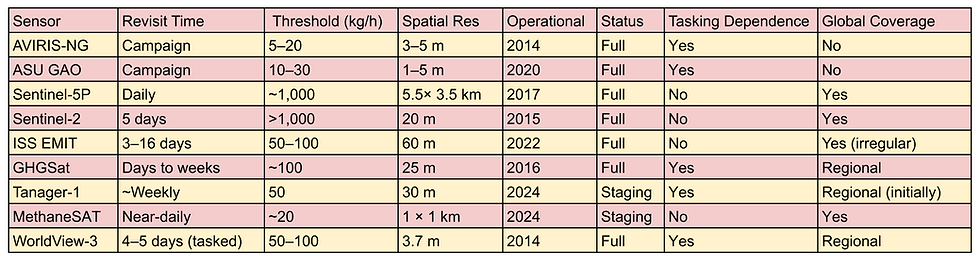
We have summarized the methane remote sensing modalities in table 1.
3. Conclusion
Addressing Australia's agricultural methane emissions will likely demand an integrated approach leveraging cutting-edge remote sensing technologies alongside robust policy frameworks. The distributed and low-flux nature of emissions from livestock operations – typically ranging from 20–800 kg CH₄/hour per facility - poses significant detection challenges for incumbent satellite systems like Sentinel-5P, which lack the spatial resolution and sensitivity to resolve small, transient sources. However, emerging satellite constellations, such as MethaneSAT, with 20 kg CH₄/hour sensitivity and near-daily global coverage, and Tanager-1, with 30 m resolution, 50 kg CH₄/hour detection threshold, promise improved capabilities.
Whereas MethaneSAT provides regional coverage, Tanager-1 provides point source targeting. Tasked products, such as GHGSat or aerial modalities, may still have their utility, where priority targets need intensive monitoring. Indeed, legacy products may also still add value if the challenges around detection limits can be managed, for example in retrospective analysis (Sentinel-5P and Sentinel-2 products are available as far back as 2017, and 2018, respectively). The integration of these technologies will not only improve source attribution, but also enable policymakers to track emission trends, verify mitigation efforts, and prioritize interventions in high-impact sectors like dairy and feedlots.
References
1. Dairy Australia (2023) Australian Dairy Industry Overview. Available at: https://www.dairyaustralia.com.au (Accessed: 15 June 2023).
2. Australian Lot Feeders’ Association (ALFA) (2023) Industry Statistics. Available at: https://www.feedlots.com.au (Accessed: 15 June 2023).
3. Department of Climate Change, Energy, the Environment and Water (2024). '$9 million for research trials to help farmers lower livestock emissions'. Available at: https://www.dcceew.gov.au/about/news/9-million-research-trials-help-farmers-lower-livestock-emissions
4. Department of Climate Change, Energy, the Environment and Water (2022). 'Quarterly Update of Australia's National Greenhouse Gas Inventory: June 2022'. Available at: https://www.dcceew.gov.au/sites/default/files/documents/nggi-quarterly-update-june-2022.pdf
5. Badgery, W., Li, G., Simmons, A., Wood, J., Smith, R., Peck, D., Ingram, L., Durmic, Z., Cowie, A., Humphries, A. and Hutton, P., 2023. Reducing enteric methane of ruminants in Australian grazing systems–a review of the role for temperate legumes and herbs. Crop and Pasture Science.
6. “NSW Sydney scientists are getting up close to cattle to accurately measure just how much methane they release into the atmosphere”. https://www.unsw.edu.au/newsroom/news/2024/09/tracking-emissions-from-cow-burps-and-manure-with-precision
7. "California’s Top Methane Emitter is a Vast Cattle Feedlot. For Now, Federal and State Greenhouse Gas Regulators Are Giving It a Pass." https://insideclimatenews.org/news/18082023/californias-top-methane-emitter-is-cattle-feedlot/
8. CarbonMapper Data API. https://data.carbonmapper.org/#1/30.8/50.5
9. Australian Government Department of Climate Change, Energy, the Environment and Water [2022] National Greenhouse Gas Inventory 2021, Canberra: Australian Government.
10. Thompson, D.R. et al. [2019] ‘Atmospheric correction for global mapping spectroscopy: ATREM advances for the HyspIRI preparatory campaign’, Atmospheric Measurement Techniques, 12[10], pp. 5659–5674.
11. Frankenberg, C. et al. [2014] ‘Probing methane in terrestrial planets with high-resolution spectroscopy’, Nature, 514[7521], pp. 436–439.
12. NASA Jet Propulsion Laboratory [2021] AVIRIS-NG Mission Cost Analysis, Pasadena: NASA JPL.
13. Thompson, D.R. et al. [2022] ‘High-resolution methane mapping with the Global Airborne Observatory reveals emission sources in California’, Remote Sensing of Environment, 269, p. 112794.
14. Baray, S. et al. [2022] ‘Detecting methane plumes in TROPOMI data using machine learning’, Environmental Research Letters, 17[6], p. 064030.
15. Varon, D.J. et al. [2019] ‘Quantifying methane point sources from fine-scale satellite observations of atmospheric methane plumes’, Remote Sensing of Environment, 233, p. 111367.
16. Sánchez-García, E., Gorroño, J., Irakulis-Loitxate, I., Varon, D.J. and Guanter, L., 2021. Mapping methane plumes at very high spatial resolution with the WorldView-3 satellite. Atmospheric Measurement Techniques Discussions, 2021, pp.1-26.
17. Thorpe, A.K. et al. [2023] ‘EMIT: New capabilities for methane detection from the International Space Station’, Geophysical Research Letters, 50[4], p. e2023GL103713.
18. GHGSat [2023] GHGSat-D: Advanced Methane Monitoring Satellite, Montreal: GHGSat Inc.
19. GHGSat Press Release, May 2022. "Cow burps seen from space". https://www.ghgsat.com/en/newsroom/cow-burps-seen-from-space/
20. Carbon Mapper [2023] Tanager-1 Mission Overview: Technical Specifications, Tucson: Carbon Mapper Coalition.
21. MethaneSAT LLC [2023] MethaneSAT Technical Specifications: Instrument and Mission Design, Boulder: MethaneSAT.
22. MethaneSat Concentrations, demonstration products. https://drive.google.com/drive/folders/1FjSCBad0c0M3pQk951Ys-Csk7fJ_UATV


留言